Parallel Coordinates
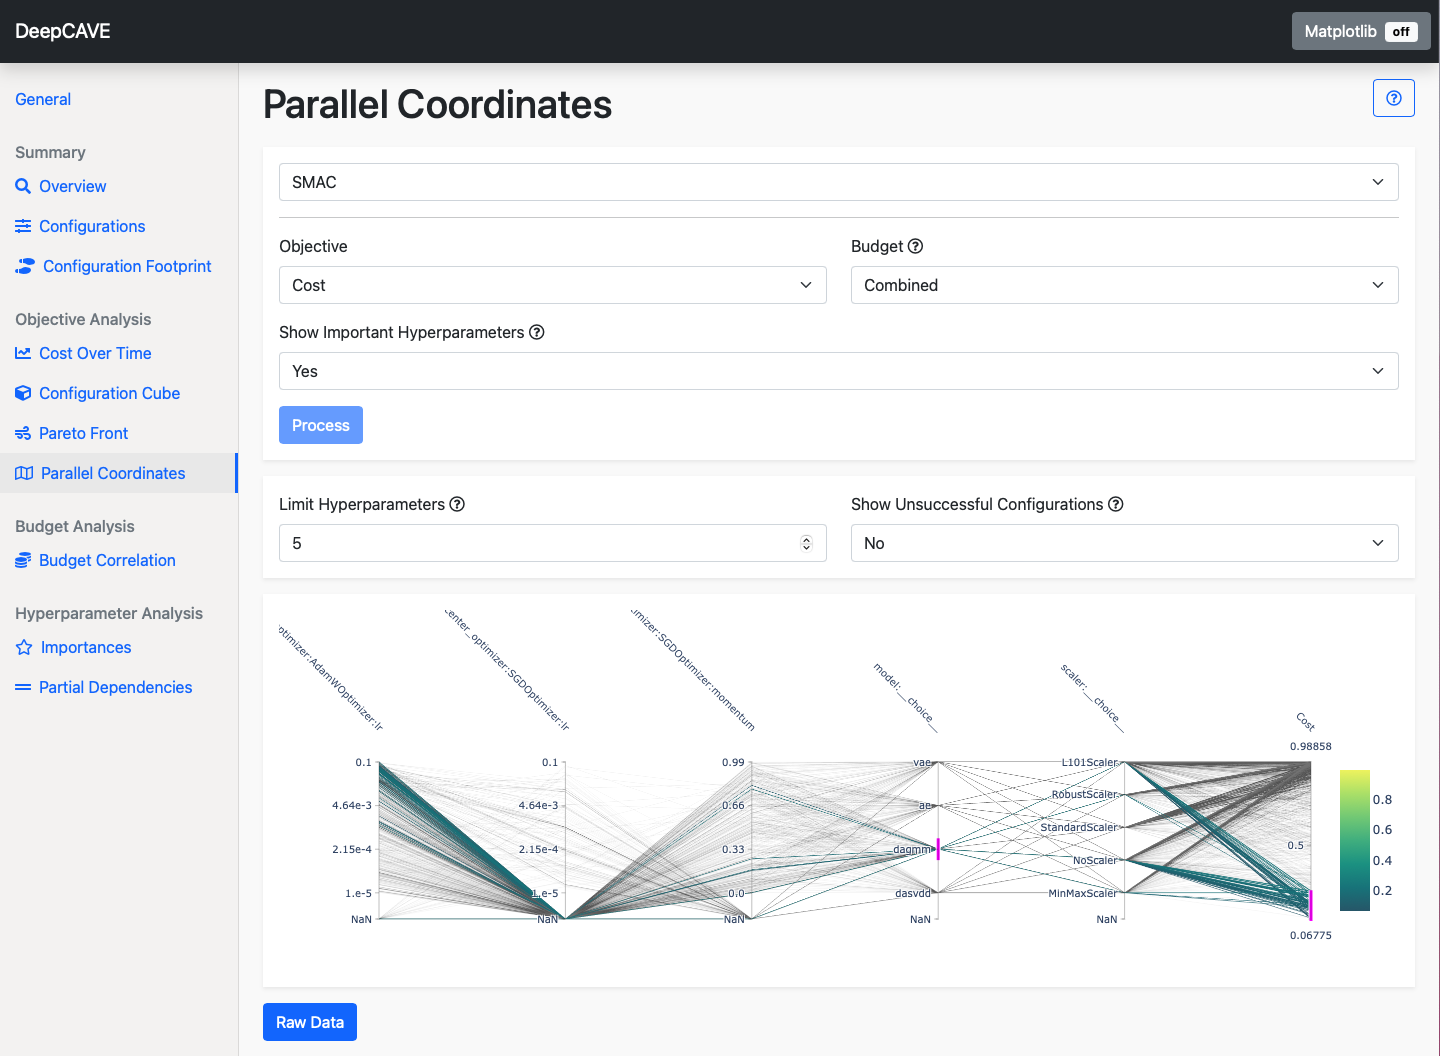
The Parallel Coordinates plugin visualizes hyperparameter configurations as a line through their hyperparameter values and their final objective score. This visualization helps in identifying trends and patterns related to the final scores achieved by various configurations. For example, you may find that high performing configurations all share the same value for a certain categorical hyperparameter, as indicated by many high scoring lines passing through this value. The lines can be ordered according to their fANOVA importance from right to left (i.e. more important hyperparameters are closer to the objective score on the right).
This can help provide insight and answers to various questions:
Which hyperparameter values or combinations are associated with high or low final scores?
What preferences does the optimizer exhibit for certain hyperparameters?
Using the plot
The plot offers some interactive features for in-depth analysis:
Visual Filters: Add visual filters by drawing lines on the hyperparameter or objective value ranges. on the axes. For instance, placing a line on the objective value range allows you to filter configurations within that specific range. Multiple filters can be applied, and clicking on them again will remove them.
Re-arranging: You can drag and reposition the hyperparameters and the objective to better group and compare them. This feature helps in customizing the view to focus on relevant hyperparameters for your analysis.
Options
Objective: Here you can select the objective you wish to analyze for. The final scores are depicted as the last item along the x-axis.
Budget: Select the multi-fidelity budget to be used. The plugin will only consider trials evaluated on the selected budget. The Combined budget option displays all configurations but shows scores only from the highest budget if a configuration was evaluated with multiple budgets.
Show Important Hyperparameters: Order hyperparameters according to their fANOVA importance. The more right a hyperparameter stands, the more important it is. Activating this option might take longer.
To refine your analysis, you can apply filters after calculation:
Limit Hyperparameters: Shows either the N most important hyperparameters (if show important hyperparameters is true) or the first N selected hyperparameters.
Hyperparameters: Shows only the selected hyperparameters (only available if “Show Important Hyperparameters” is false).
Show Unsuccessful Configurations: By default, we do not crowd the plot with configurations that did not manage to complete but you can enable plotting them by changing this to Yes. This can be useful to identify hyperparameters or combinations of them that caused the trial to crash.