Overview
This plugin allows you to see the most important information about your selected runs. It can serve as sanity check and let’s you know about the meta data, objectives, and statistics of your selected run.
The Overview is split into 5 parts:
Quick Information
Meta
Objectives
Statuses
Configuration Space
This plugin is capable of answering the following questions:
Which optimizer was used?
When was the latest change of the optimizer’s data?
What is the best configuration?
Are the meta data as expected?
Are the objectives as expected?
Is the configuration space as expected?
How many trials have been successful/unsuccessful?
Why did certain trials crash?
On which multi-fidelity budgets were the configurations evaluated?
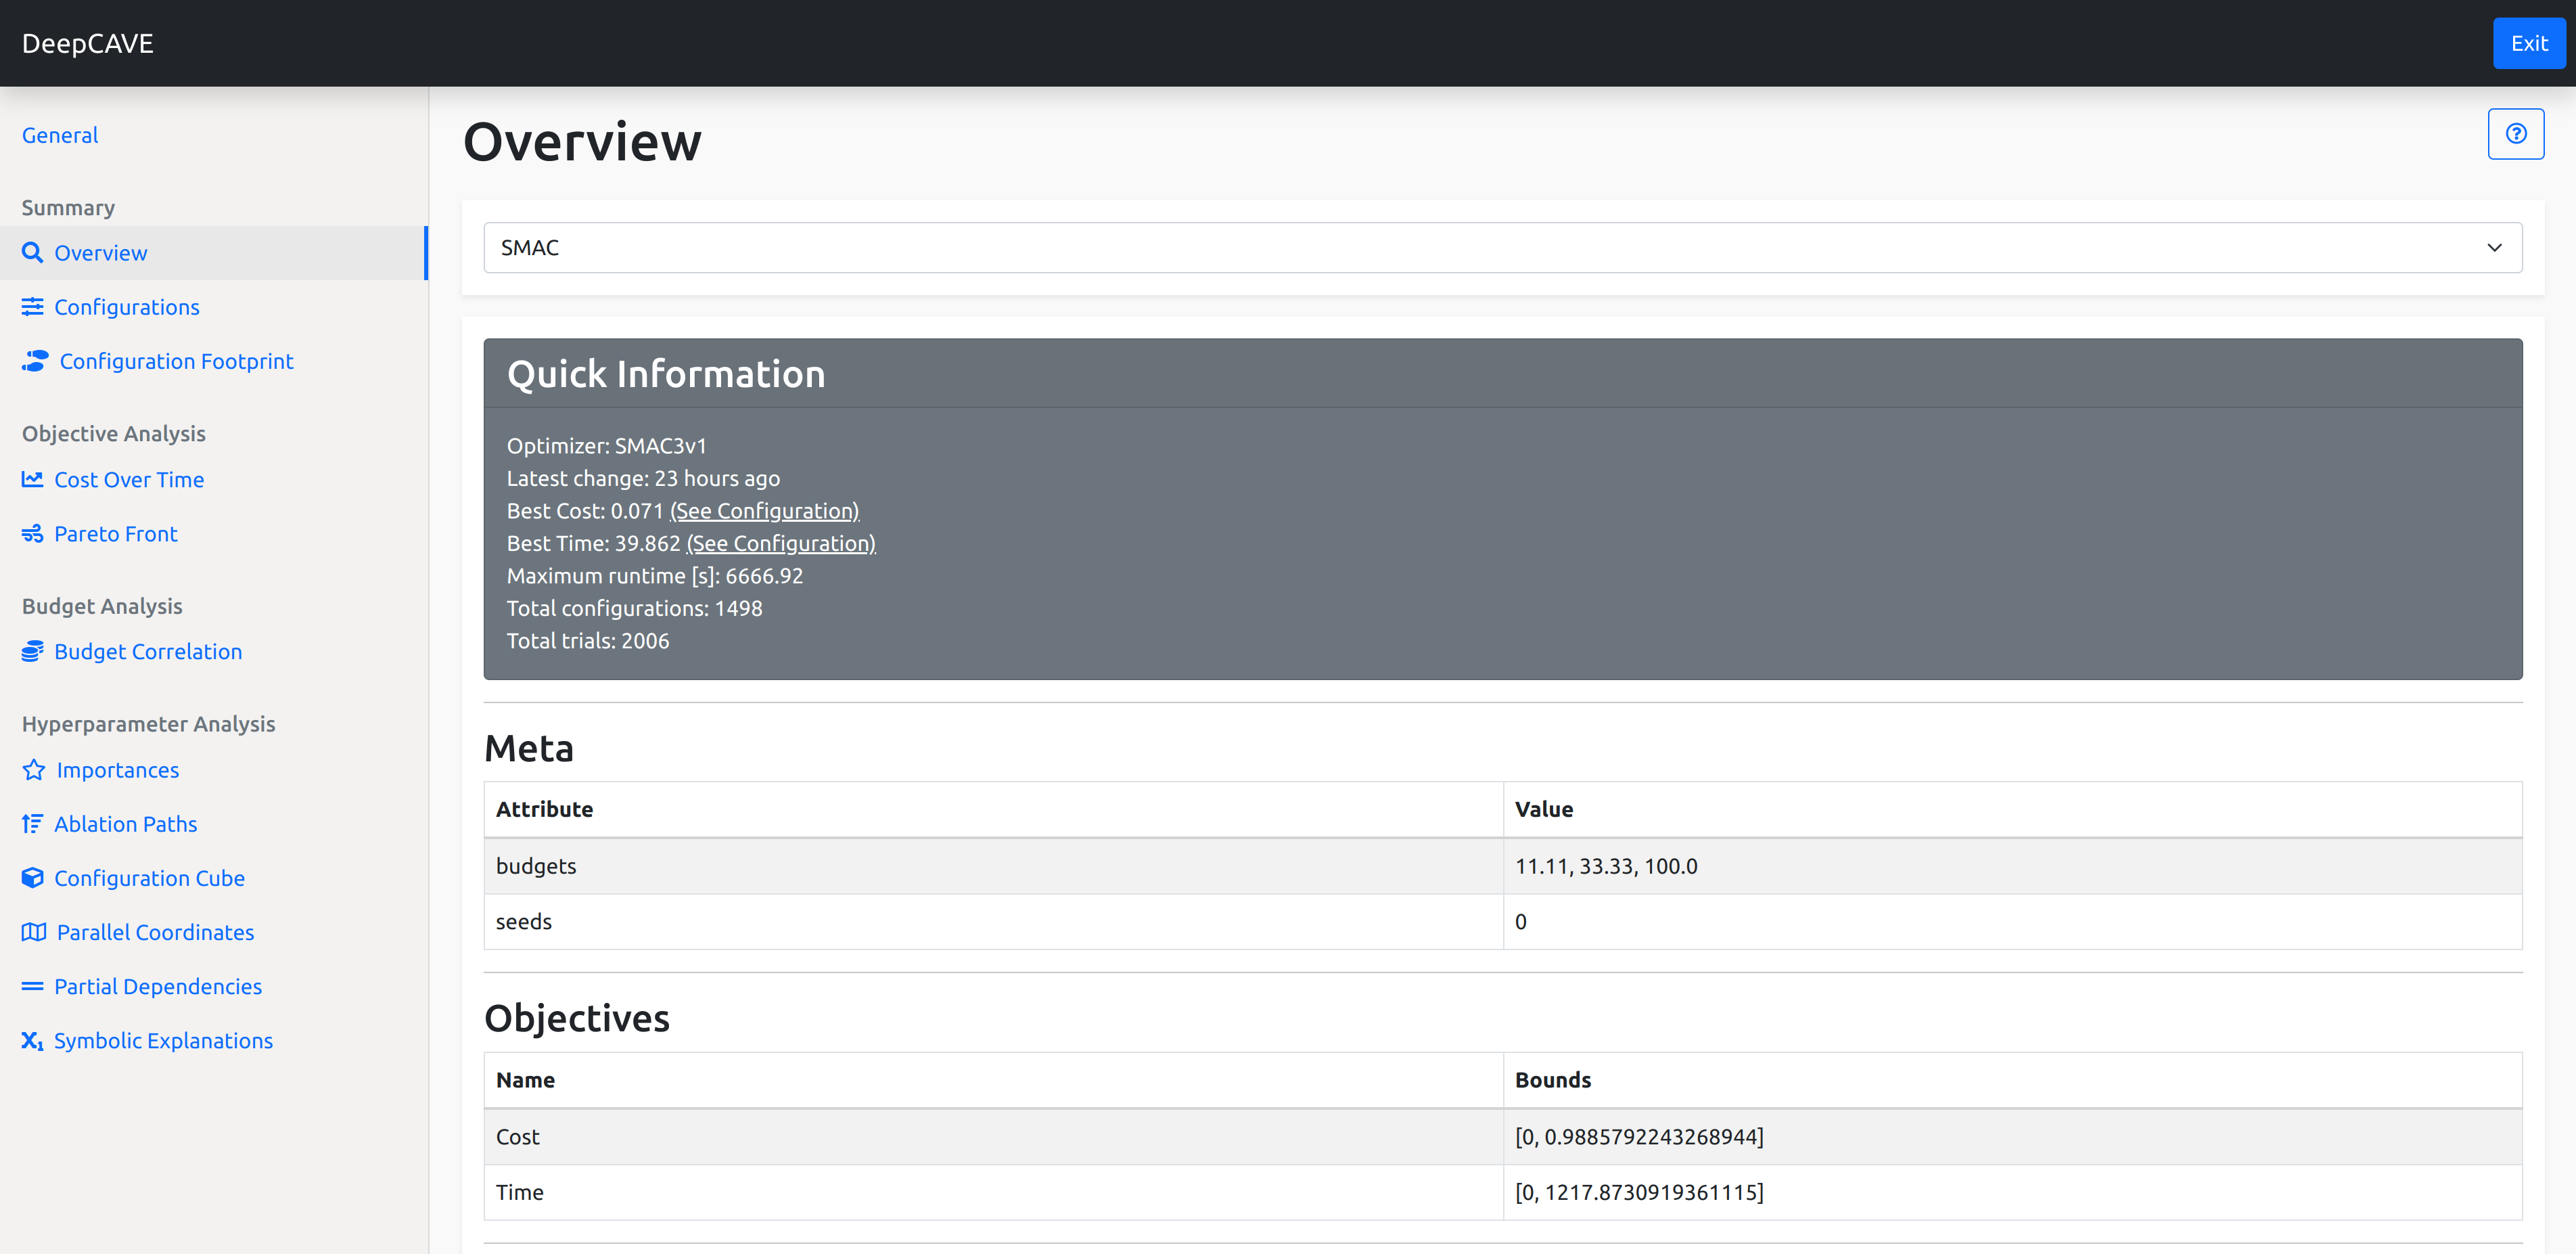
Quick Information
Here you’ll find information regarding summary statistics about your run or group of runs. This includes information about the optimizer used, how many configurations were tried, when the runs were last updated, and a handy quick link to the best configuration with respect to the different objectives.
Meta
Next, we show meta information regarding your runs. Notably, you can see information such as the possible budget allocations that were considered during the run. The budget is the amount of resources that were allocated to a configuration as it was being evaluated using a multi-fidelity approach.
Objectives
In this section, you can see information regarding the objectives that were considered during the optimization run, such as their names and the bounds they were in.
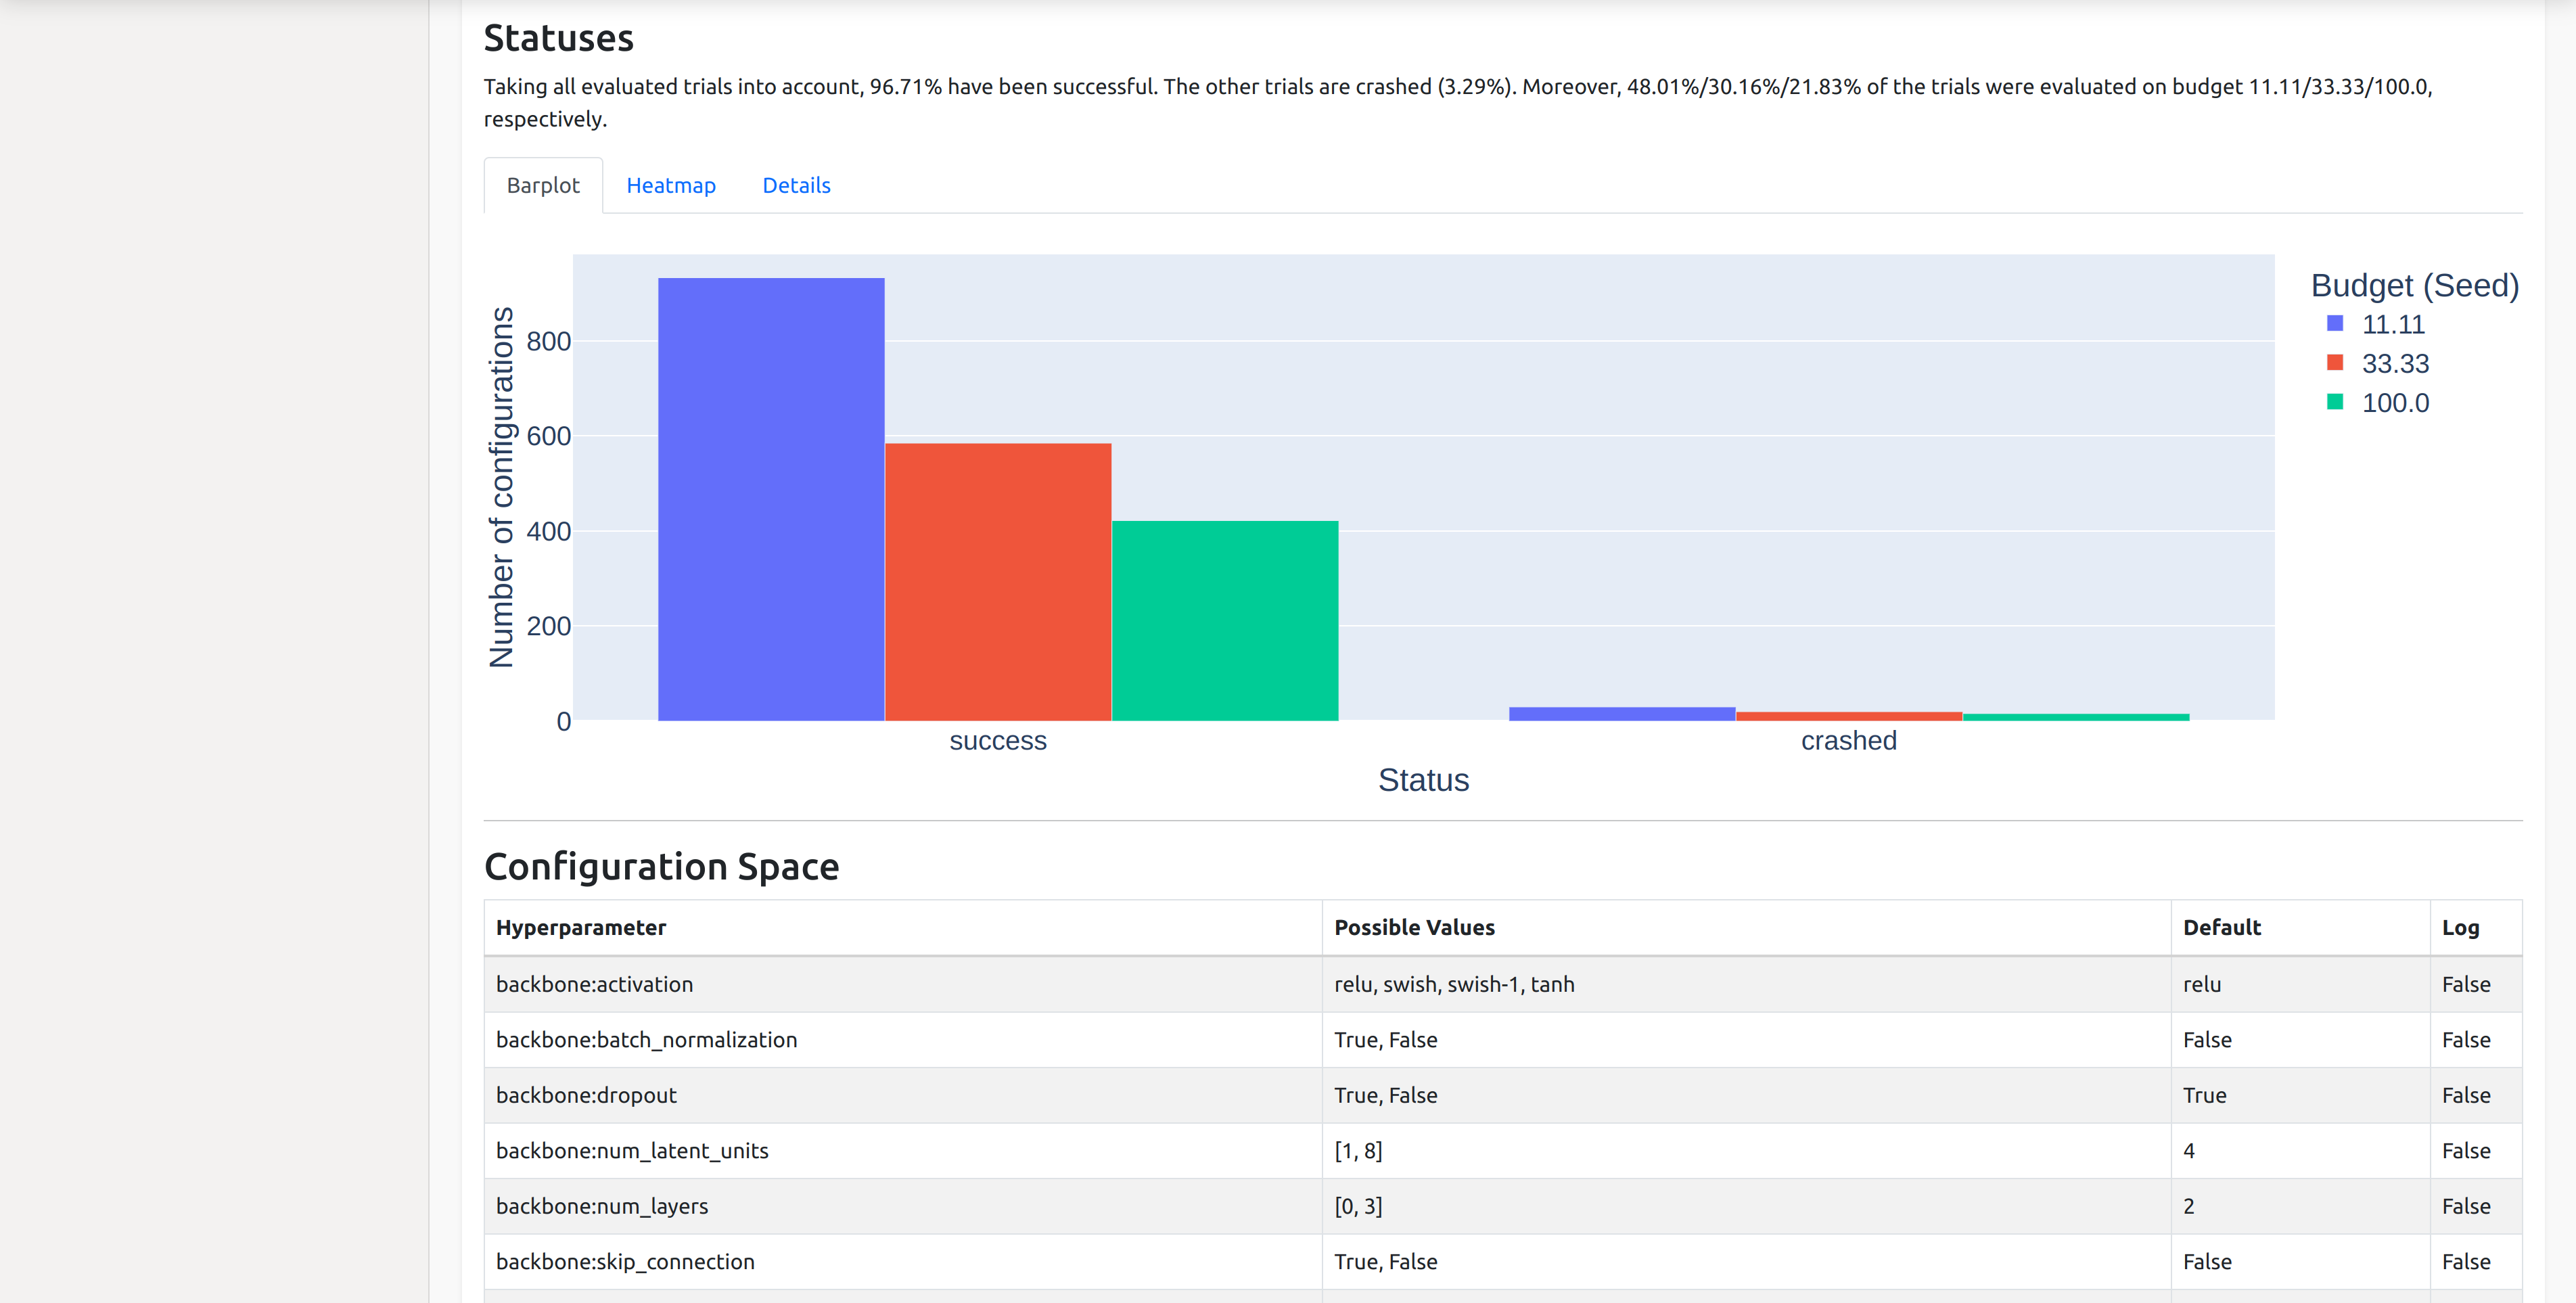
Statuses
To get a nice overview of the optimization run, we provide a barplot showing the statuses of the trials. You can also view these as a heatmap or get more information from the details tab.
The Barplot shows how many trials received which status and under which budget allocation. These are grouped according to the budget and coloured based on the status they exited with.
To explore which configurations received which status as they progressed through different budget levels, navigate to the Heatmap tab. Here, the x-axis displays budget allocation and seed, while the y-axis shows the configuration IDs. This view allows you to analyze how your optimizer balances out low-budget and full-budget evaluations. In an ideal scenario, you would see mostly SUCCESS bars spanning across the entire plot, possibly with some NOT_EVALUATED lines indicating there are further configurations to try. However, if you faced many crashes at high budgets for example, you’ll see CRASHED bars from the highest budget onwards.
In the Details tab, you will find an overview of configurations that were not successful. This section provides brief information on the configuration ID, the budget under which it was evaluated, and the status it received. If an error is associated with a configuration, such as one that resulted in a CRASHED status, the error details will be displayed in the error column (if the run includes an error traceback).
Configuration Space
Lastly, you can find details about the configuration space that was optimized. This section includes information on the name of each hyperparameter, the possible values that could be explored, the default value, and whether the optimization was performed on a logarithmic or a linear scale.