Cost Over Time
One of the goals of using AutoML is to achieve high peak performance. However, it is also important to track how the objectives evolve over time. This plugin visualizes these changes based on time or the number of trials evaluated.
With support for multiple runs, you can easily see which run performs best at various points in time. If you choose to display groups of combined runs, the plugin will also show the mean and standard deviation, providing a clearer picture of performance trends.
Note
The configuration spaces of the selected runs should be equal. Otherwise, a good comparison is not possible. They can, however, still be displayed in the same graph.
Note
For non-deterministic runs (i.e. multiple seeds evaluated per configuration), only configurations evaluated on the maximum number of seeds are considered for choosing the best configuration at a given point in time.
This plugin is capable of answering the following questions:
Does the optimizer converge?
How does optimizer A compare to optimizer B? Is optimizer A more effective than optimizer B?
How long does it take for the optimizer to reach a specific objective value?
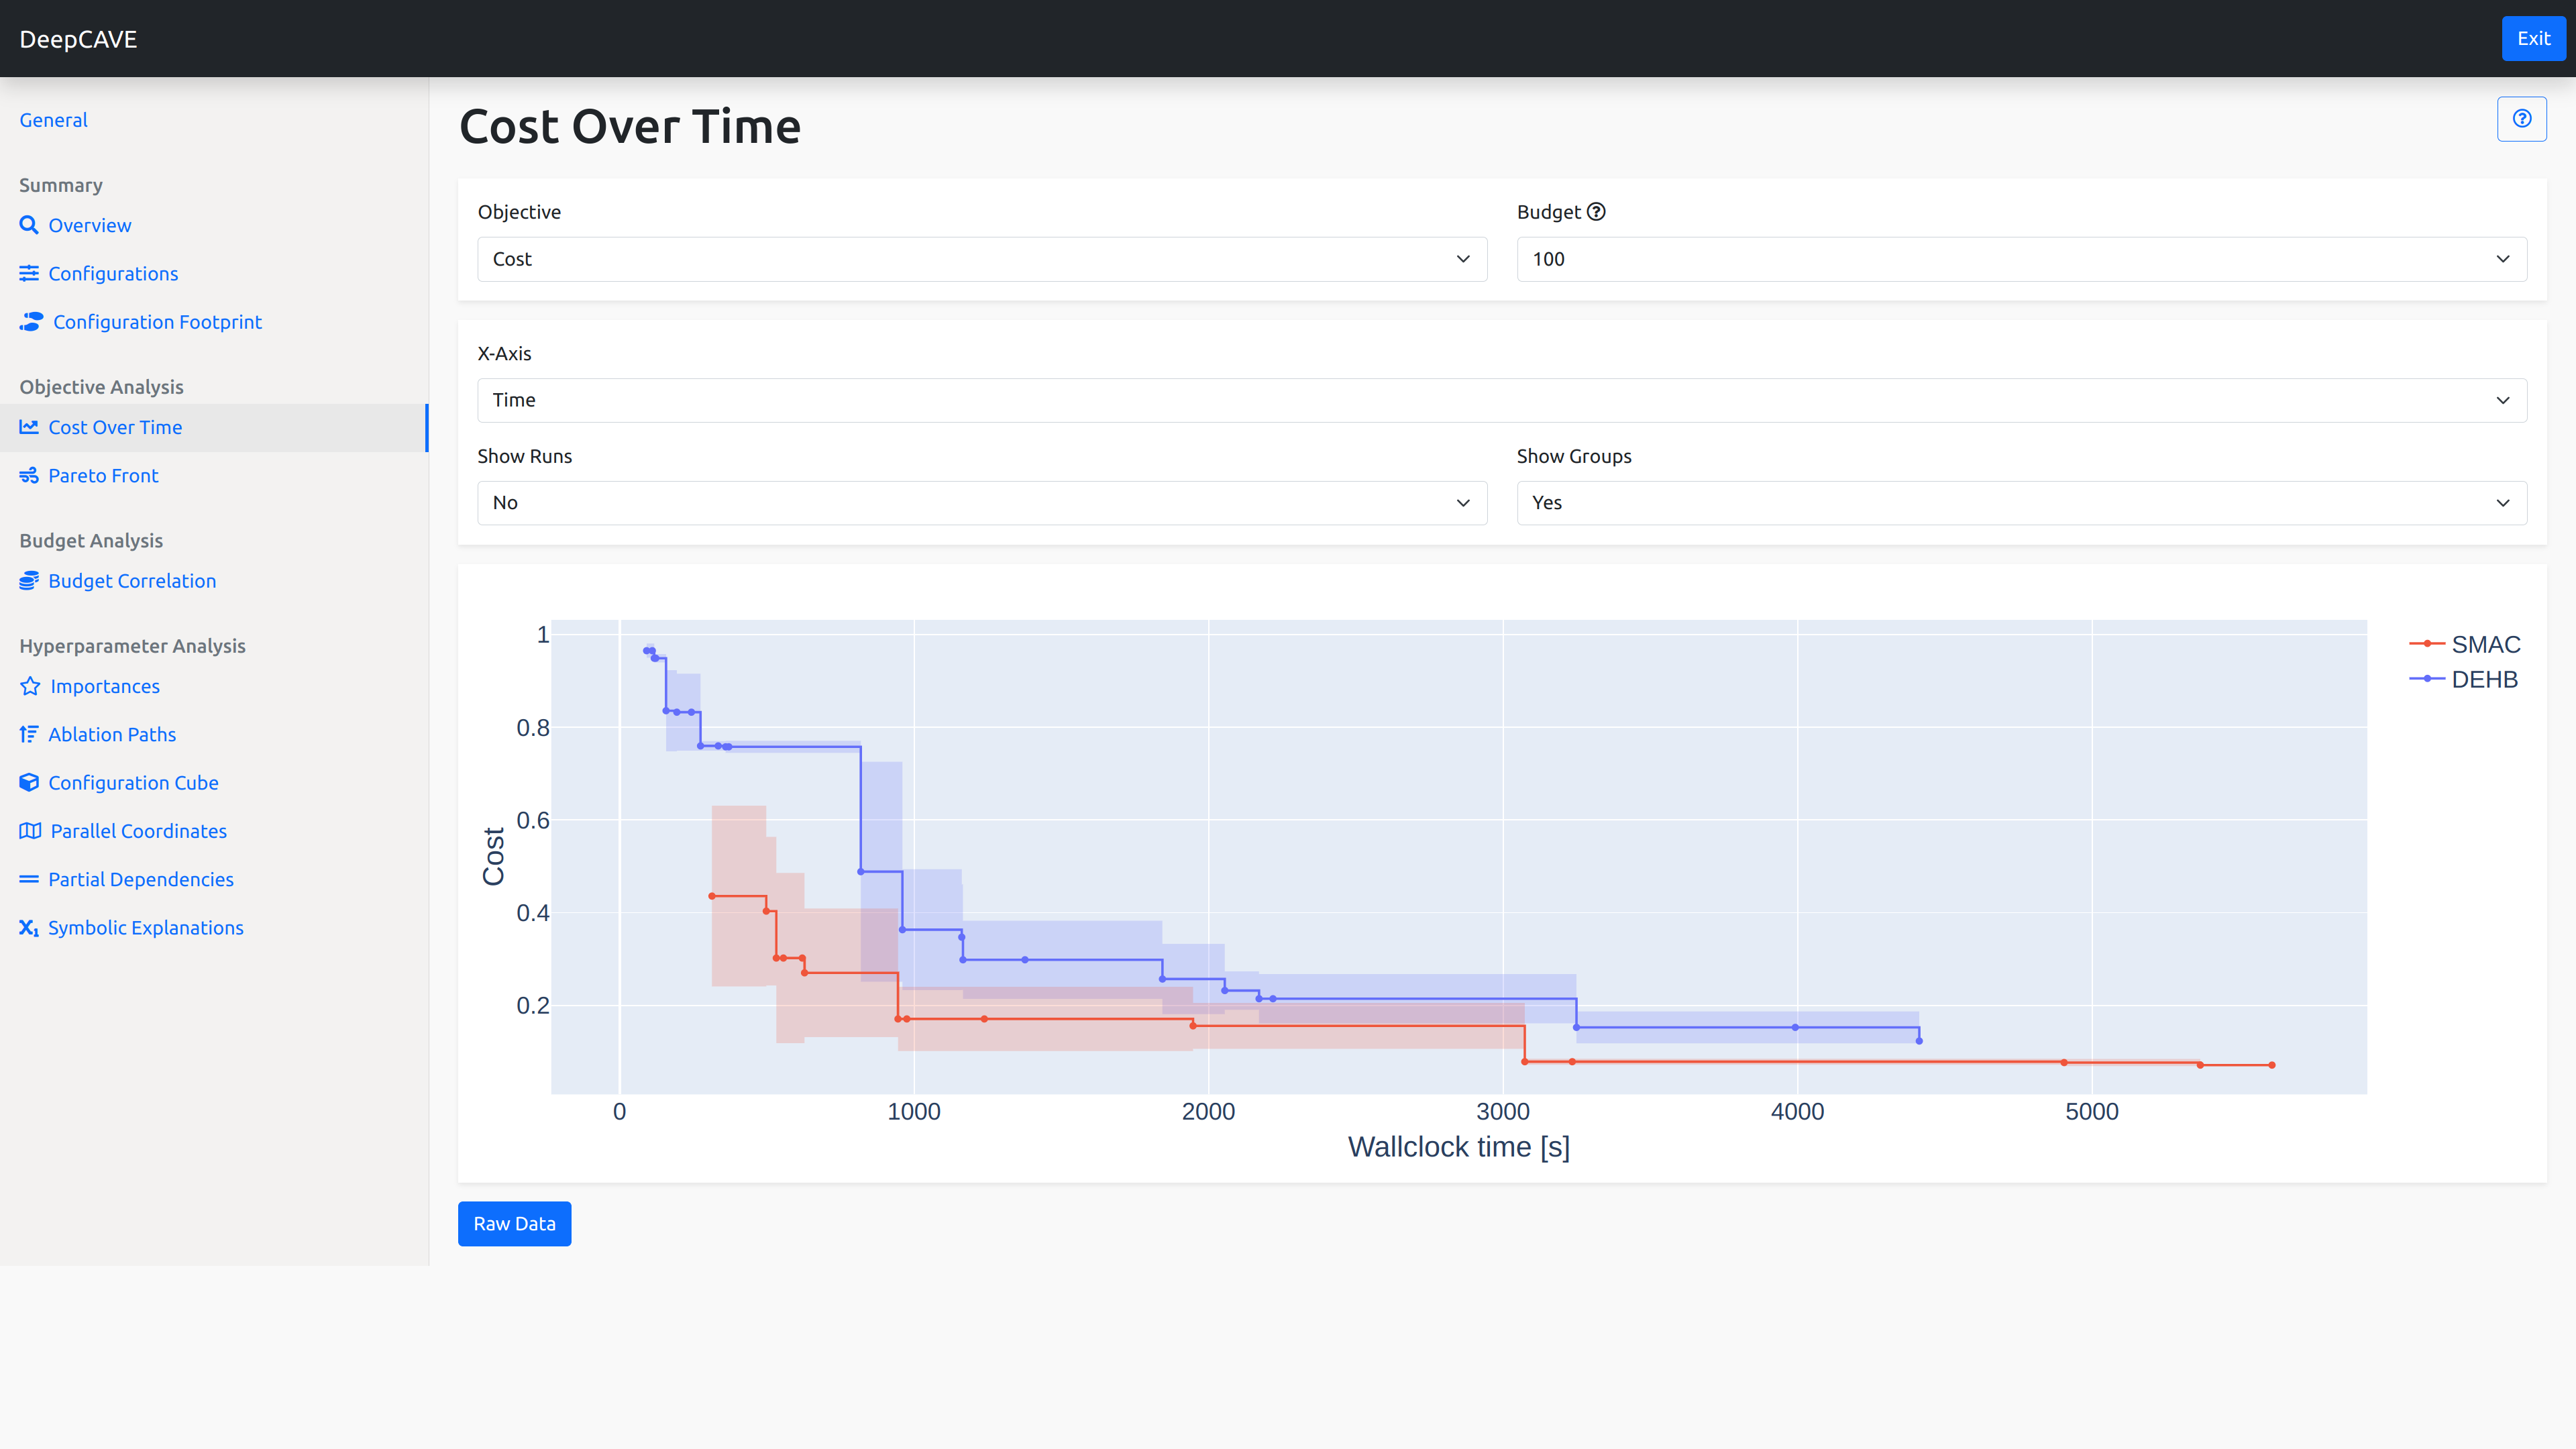
Interpretation
As mentioned above, the resulting graph shows the objective values on the y-axis and the time on the x-axis. By examining the lines, you can determine when a particular run or group outperforms or underperforms relative to others, and at what times. This graph is particularly useful for assessing which optimizer converges more quickly and whether the optimizer converges at all.
In contrast to individual runs, groups show the mean and standard deviation across all runs within the group. This feature helps you understand the variability and spread among multiple runs.
Options
Objective: Select the objective function you wish to analyze.
Budget: Select the multi-fidelity budget to be used. The plugin will only consider trials evaluated on the selected budget. The Combined budget option displays all configurations but shows scores only from the highest budget if a configuration was evaluated with multiple budgets.
To refine your analysis, you can apply various filters after calculation:
X-Axis: You can adjust the x-axis to suit your needs using the available options. For long-running processes, a logarithmic scale is often more useful.
Show Runs / Show Groups: You can choose to display either individual runs, groups of runs, or both.