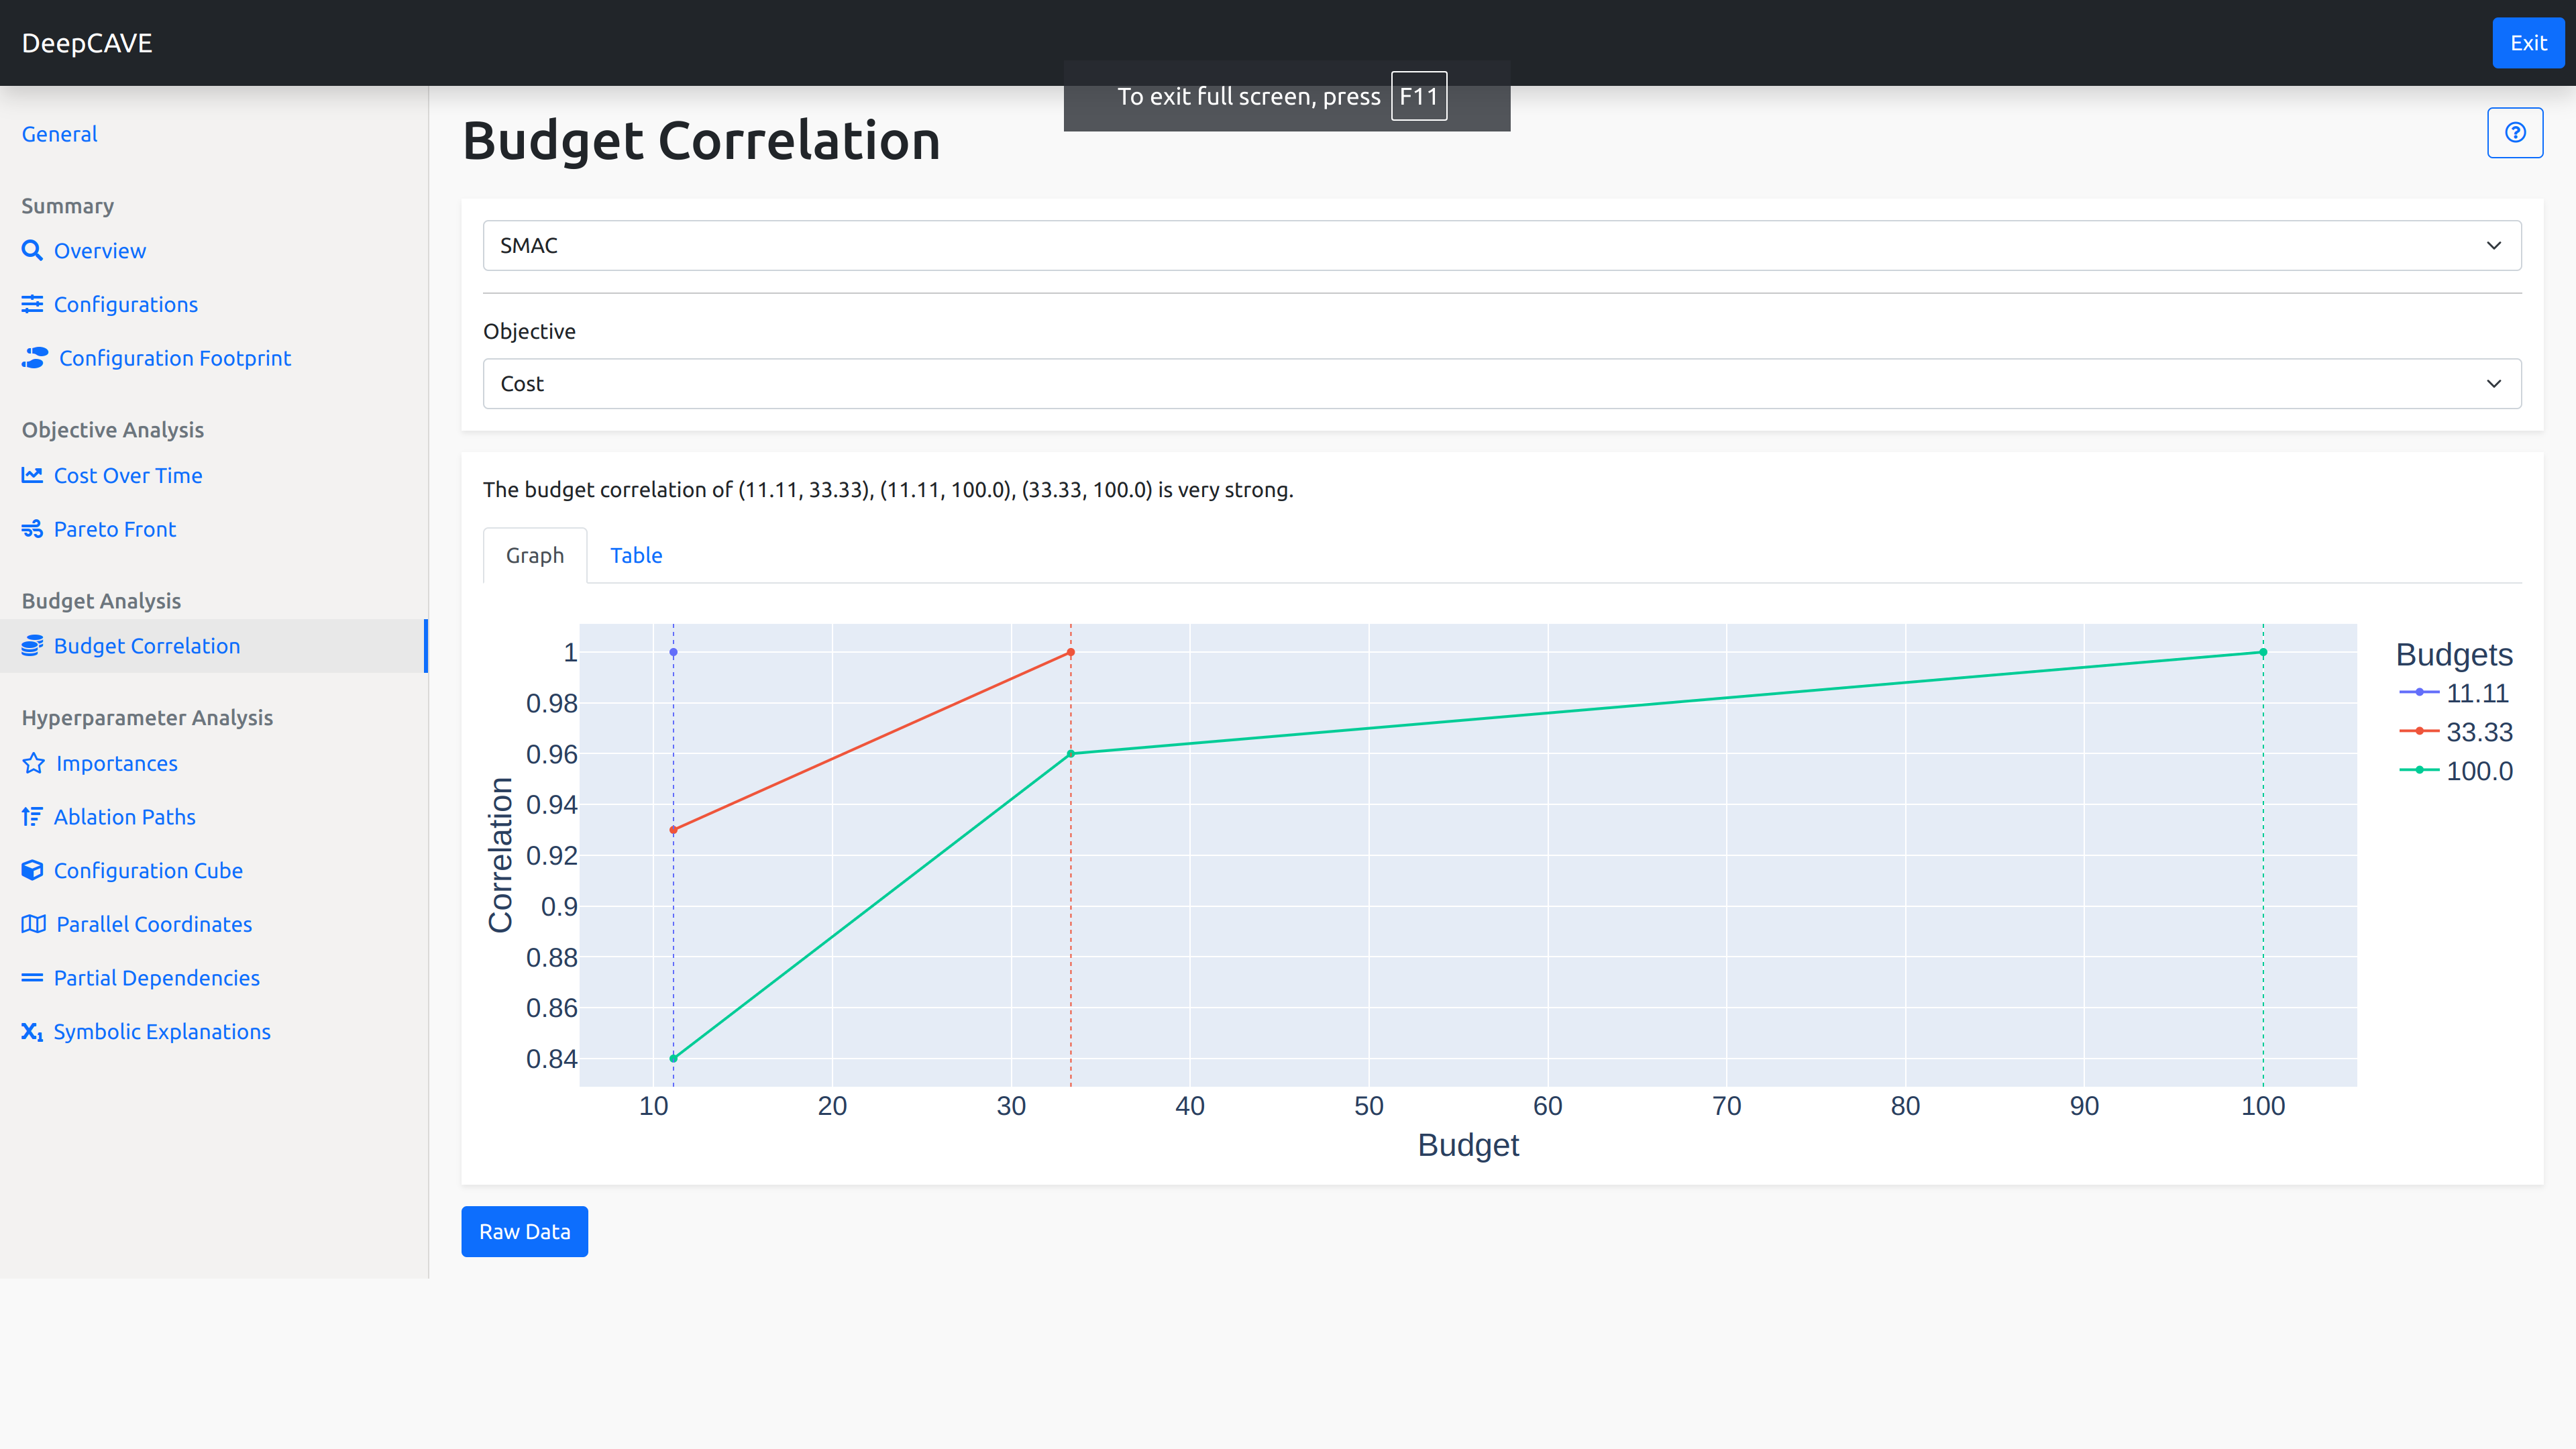
Budget Correlation
When multiple budgets are used, it can be challenging to determine how representative lower budgets are of the final objective score if the same configuration were evaluated at a higher budget. One way to assess this is through budget correlation. If a lower budget correlates well with a higher budget, it indicates that evaluating configurations at a lower budget is likely good enough to infer their performance at higher budgets. Conversely, if a low budget does not correlate with higher budgets, it suggests that full evaluation at higher budgets is necessary to get an accurate performance measure.
For instance, in neural networks, once convergence is achieved, longer training may not significantly impact the result. If convergence is reached at budget 1 but training continues until budget 2, the correlation between budgets 1 and 2 will be high.
This plugin is capable of answering following questions:
Are low budget trials a fair representation of a configuration’s true performance if evaluated at a higher budget?
Should I consider running further optimization at lower budgets to cover more of the configuration space?

Correlation Interpretation
The first step is to evaluate how the highest budget correlates with all lower budgets. You can start by verifying that the highest budget perfectly correlates with itself, which will give you a correlation value of 1. Then, you can trace the correlation of this highest budget with previous, lower budgets.
Typically, you may find that the highest budget shows a stronger correlation with mid-range budgets and the correlation tends to decrease as you compare it with progressively lower budgets.
There is no definitive threshold for what a specific correlation value means, as it depends on your goals and the resources available. If you aim to determine whether you can conduct further runs with reduced budgets to expedite the search for optimal configurations, ensure that the highest budget has a strong correlation with the lowest budget, ideally achieving a correlation score of at least 0.7. This number is somewhat arbitrary and should be interpreted in the context of your specific situation. For reference, here’s a guideline for interpreting correlation scores:
>=0.70: Very strong relationship
0.40-0.69: Strong relationship
0.30-0.39: Moderate relationship
0.20-0.29: Weak relationship
0.01-0.19: No or negligible relationship
Options
Objective: Select the objective function you wish to analyze.