
Note
Click here to download the full example code or to run this example in your browser via Binder
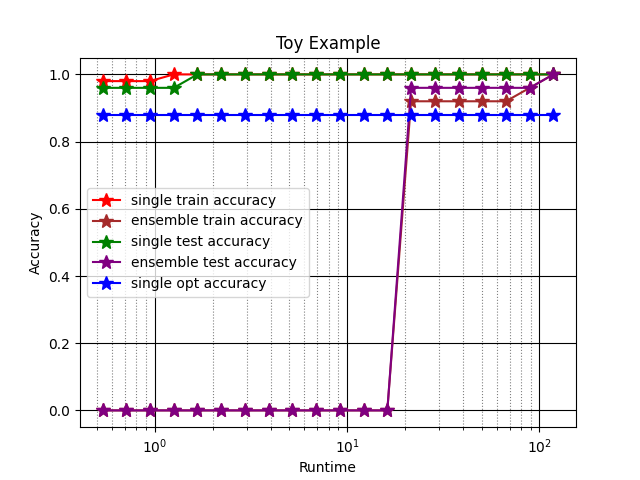
Plot the Performance over Time
Auto-Pytorch uses SMAC to fit individual machine learning algorithms and then ensembles them together using Ensemble Selection.
The following examples shows how to plot both the performance of the individual models and their respective ensemble.
Additionally, as we are compatible with matplotlib, you can input any args or kwargs that are compatible with ax.plot. In the case when you would like to create multipanel visualization, please input plt.Axes obtained from matplotlib.pyplot.subplots.
import warnings

import numpy as np
import pandas as pd

from sklearn import model_selection

import matplotlib.pyplot as plt

from autoPyTorch.api.tabular_classification import TabularClassificationTask
from autoPyTorch.utils.results_visualizer import PlotSettingParams


warnings.simplefilter(action='ignore', category=UserWarning)
warnings.simplefilter(action='ignore', category=FutureWarning)
Task Definition
n_samples, dim = 100, 2
X = np.random.random((n_samples, dim)) * 2 - 1
y = ((X ** 2).sum(axis=-1) < 2 / np.pi).astype(np.int32)
print(y)

X, y = pd.DataFrame(X), pd.DataFrame(y)
X_train, X_test, y_train, y_test = model_selection.train_test_split(X, y)
[0 0 0 1 0 0 0 1 1 1 1 0 1 0 1 0 0 1 0 0 0 0 1 0 0 0 0 1 0 1 1 0 1 0 0 1 1
 0 1 0 1 1 0 1 0 0 1 0 0 1 1 0 0 0 0 0 0 1 0 1 1 0 1 1 0 0 1 1 0 1 0 0 0 0
 1 0 1 1 1 0 0 0 1 0 1 1 0 1 0 0 1 0 1 0 0 0 1 0 1 0]
API Instantiation and Searching
api = TabularClassificationTask(seed=42)

api.search(X_train=X_train, y_train=y_train, X_test=X_test, y_test=y_test,
           optimize_metric='accuracy', total_walltime_limit=120, func_eval_time_limit_secs=10)
<autoPyTorch.api.tabular_classification.TabularClassificationTask object at 0x7f9aa68dbe80>
Create Setting Parameters Object
metric_name = 'accuracy'

params = PlotSettingParams(
    xscale='log',
    xlabel='Runtime',
    ylabel='Accuracy',
    title='Toy Example',
    figname='example_plot_over_time.png',
    savefig_kwargs={'bbox_inches': 'tight'},
    show=False  # If you would like to show, make it True and set figname=None
)
Plot with the Specified Setting Parameters
_, ax = plt.subplots() <=== You can feed it to post-process the figure.
# You might need to run `export DISPLAY=:0.0` if you are using non-GUI based environment.
api.plot_perf_over_time(
    metric_name=metric_name,
    plot_setting_params=params,
    marker='*',
    markersize=10
)
Total running time of the script: ( 2 minutes 16.039 seconds)