Note
Click here to download the full example code or to run this example in your browser via Binder
Performance-over-time plot
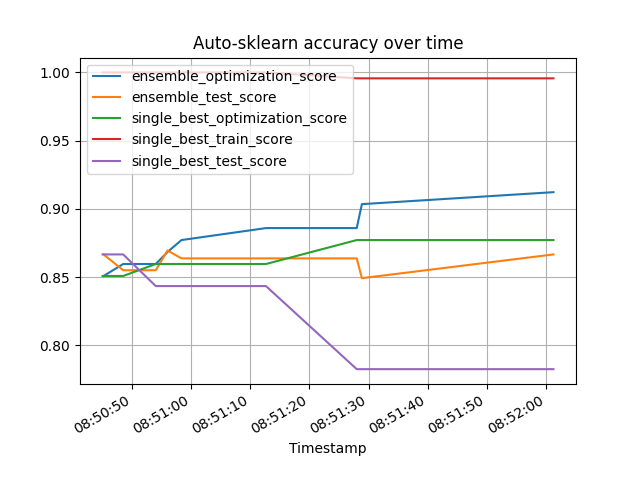
This example shows, how to use the performance_over_time_ attribute to plot the performance over train time. performance_over_time_ can contain multiple metrics within a pandas dataframe, namely:
ensemble_optimization_score
ensemble_test_score
single_best_optimization_score
single_best_test_score
single_best_train_score
auto-sklearn can automatically encode categorical columns using a label/ordinal encoder. This example highlights how to properly set the dtype in a DataFrame for this to happen, and showcase how to input also testing data to autosklearn.
The X_train/y_train arguments to the fit function will be used to fit the scikit-learn model, whereas the X_test/y_test will be used to evaluate how good this scikit-learn model generalizes to unseen data (i.e. data not in X_train/y_train). Using test data is a good mechanism to measure if the trained model suffers from overfit, and more details can be found on evaluating estimator performance.
In order to provide *_test_score metrics, X_test and y_test must be provided to the AutoML-Model, as shown in this example.
There is also support to manually indicate the feature types (whether a column is categorical or numerical) via the argument feat_types from fit(). This is important when working with list or numpy arrays as there is no per-column dtype (further details in the example Feature Types).
import time

import matplotlib.pyplot as plt
import numpy as np
import pandas as pd
import sklearn.model_selection
import sklearn.datasets
import sklearn.metrics

from smac.tae import StatusType

import autosklearn.classification
Data Loading
# Using Australian dataset https://www.openml.org/d/40981.
# This example will use the command fetch_openml, which will
# download a properly formatted dataframe if you use as_frame=True.
# For demonstration purposes, we will download a numpy array using
# as_frame=False, and manually creating the pandas DataFrame
X, y = sklearn.datasets.fetch_openml(data_id=40981, return_X_y=True, as_frame=False)

# bool and category will be automatically encoded.
# Targets for classification are also automatically encoded
# If using fetch_openml, data is already properly encoded, below
# is an example for user reference
X = pd.DataFrame(data=X, columns=["A" + str(i) for i in range(1, 15)])
desired_boolean_columns = ["A1"]
desired_categorical_columns = ["A4", "A5", "A6", "A8", "A9", "A11", "A12"]
desired_numerical_columns = ["A2", "A3", "A7", "A10", "A13", "A14"]
for column in X.columns:
    if column in desired_boolean_columns:
        X[column] = X[column].astype("bool")
    elif column in desired_categorical_columns:
        X[column] = X[column].astype("category")
    else:
        X[column] = pd.to_numeric(X[column])

y = pd.DataFrame(y, dtype="category")

X_train, X_test, y_train, y_test = sklearn.model_selection.train_test_split(
    X, y, test_size=0.5, random_state=3
)
print(X.dtypes)
A1         bool
A2      float64
A3      float64
A4     category
A5     category
A6     category
A7      float64
A8     category
A9     category
A10     float64
A11    category
A12    category
A13     float64
A14     float64
dtype: object
Build and fit a classifier
cls = autosklearn.classification.AutoSklearnClassifier(
    time_left_for_this_task=120,
    per_run_time_limit=30,
)
cls.fit(X_train, y_train, X_test, y_test)
AutoSklearnClassifier(ensemble_class=<class 'autosklearn.ensembles.ensemble_selection.EnsembleSelection'>,
                      per_run_time_limit=30, time_left_for_this_task=120)
Get the Score of the final ensemble
predictions = cls.predict(X_test)
print("Accuracy score", sklearn.metrics.accuracy_score(y_test, predictions))
Accuracy score 0.8666666666666667
Plot the ensemble performance
The performance_over_time_ attribute returns a pandas dataframe, which can be directly used for plotting
poT = cls.performance_over_time_
poT.plot(
    x="Timestamp",
    kind="line",
    legend=True,
    title="Auto-sklearn accuracy over time",
    grid=True,
)
plt.show()

Total running time of the script: ( 2 minutes 2.445 seconds)
